Clearance Timeline Estimator
How long 510(k) decisions actually took under a product code — as a distribution, from a dated snapshot.
Clearance Time Snapshot
No product code was selected, so this sheet carries no figures from the snapshot. Look a code up at 10xand.com/clearance-timeline and print again.
Loading the product-code index…
By decision year — the full table
https://api.fda.gov/device/510k.json?search=decision_date:[2018-01-01+TO+2026-10-06]&limit=1000&skip=0
The pipeline pages this query one decision year at a time, because openFDA caps anonymous callers at a skip of 25,000 and the window holds more records than that. Paste it into a browser to pull the same records back.
Source: openFDA 510(k) endpoint, retrieved 2026-10-06. n=27036. 303 records excluded (13 no product code; 290 not a 510(k) clearance — De Novo grants). Fetched 27,339 records with decisions between 2018-01-01 and 2026-10-06, of 176,299 in the endpoint. openFDA last updated 2026-09-28.
See every 510(k) under this code in PredicateScope
Browse FDA product codes, one page each, with review times and standards
The brief
Ask us about these numbers
Computed from the same snapshot you are looking at. If you need a cut of it we do not show, say so — a person replies.
Watch it run 1:11
Preview recordingThe walkthrough that was recorded while this tool was still being designed. The tool above is the real one; this shows how it was meant to work, and it does.
How this differs from the tool above: This was recorded before the tool went live, so two things differ from what is above. The figures in it are an invented sample — the tool computes real ones. And it shows a live API call, where the tool reads a dated snapshot instead, because a snapshot can be reproduced by someone else and a live call cannot.
Transcript (13 lines)
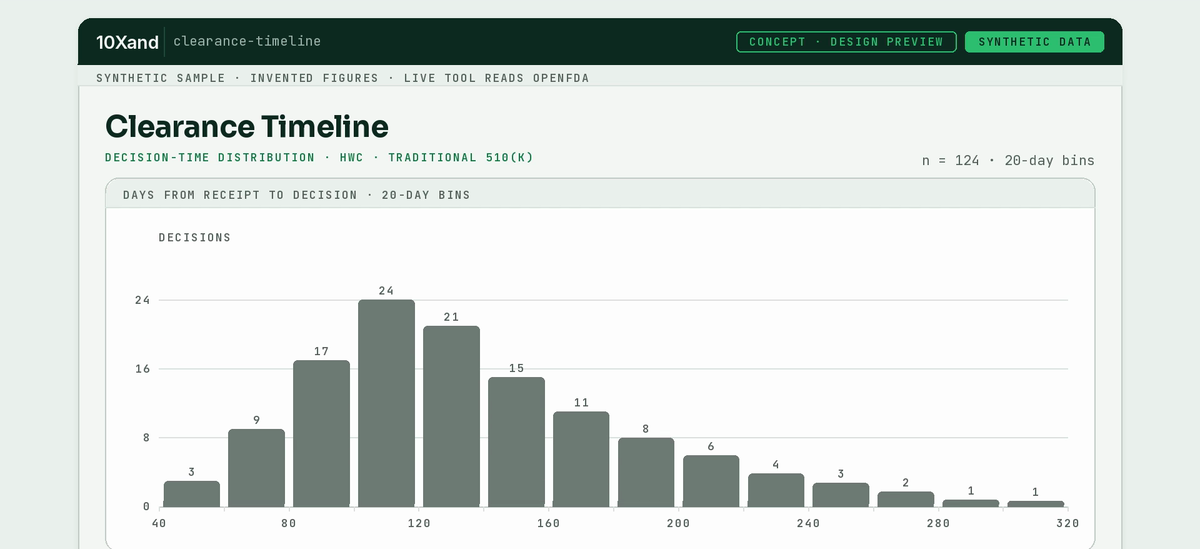
The figures spoken here — 129 days, 180, 125 decisions, a 320-day tail — are an invented sample, labelled SYNTHETIC SAMPLE and INVENTED FIGURES on screen throughout. They show the shape of the answer, not the answer. Run the tool above for real ones.
- 0:00 How long will clearance take?
- 0:02 Answer with a distribution, not folklore.
- 0:07 Program plans slip because timelines get set by anecdote.
- 0:14 Three inputs: product code, pathway, window.
- 0:20 Two numbers first: the middle, and how far the tail runs.
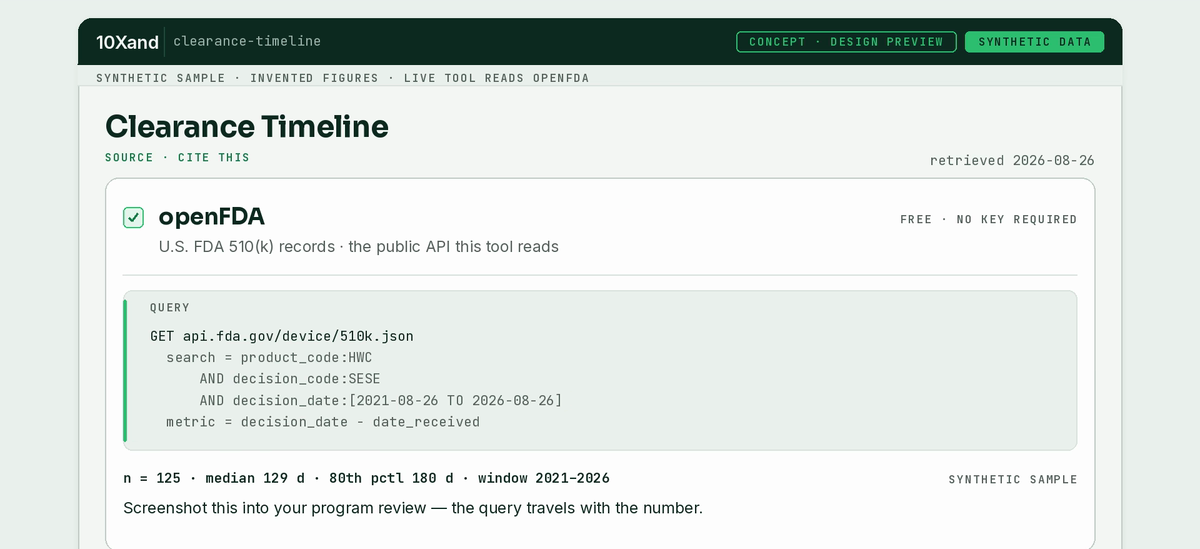
- 0:25 Half landed within 129 days. Eight in ten within 180.
- 0:32 Behind the two numbers: 125 decisions in 20-day bins.
- 0:38 There's a tail running out to 320 days.
- 0:45 A median and a spread, in plain numbers.
- 0:50 Past decisions — not a prediction for your device.
- 0:58 Every number carries the query behind it.
- 1:03 Nobody has to take your word for the figure.
- 1:08 Free at launch. Built on openFDA.
Edited before publishing: Closing line removed — it committed to publishing the full dataset every quarter, which is not a promise made anywhere else on this site.
How these numbers are computed
Every figure on this page comes from one dated file. On 2026-10-06 the pipeline pulled 27,339 records from the openFDA 510(k) endpoint with decision dates between 2018-01-01 and 2026-10-06 — one query per decision year, because openFDA caps anonymous callers at a skip of 25,000 and the window holds more records than a single query can page through. It then grouped them by product code and, for each one, computed the elapsed days between the receipt date and the decision date.
Percentiles use linear interpolation between the closest order statistics — the
inclusive method, the same one numpy.percentile uses by default and the
same one a spreadsheet's PERCENTILE.INC uses. The method is named
because the same set of numbers gives six different answers under the six common
definitions, and a percentile with no stated method cannot be reproduced by anyone
else. Everything is rounded to whole days, half away from zero.
Any cell computed from fewer than 5 clearances is removed in the pipeline, before the file is published — not hidden by this page.
That distinction matters because the snapshot is a public artifact: a rule enforced in a browser can be walked around by opening the JSON, and a rule enforced in the pipeline cannot. Under a code with three clearances, "median 214 days" is not a distribution, it is a description of three identifiable submissions. Where a year holds at least 5 but fewer than 10 clearances, the figure is published but the summary sentence says the sample is too small for that year and quotes the whole-window figure instead.
Records that cannot support a figure are counted rather than dropped. Of the 27,339 records fetched, 27,036 carried both a receipt date and a decision date and were used. 303 were excluded: 0 for a missing or inconsistent pair of dates, and 303 that reached no product code — a De Novo grant returned by the same endpoint, or a record with no product code on it. Every result view repeats the same count for the code you are looking at.
The same counting applies to the codes. 7,098 product codes are indexed and every one of them is findable, but that is the size of the index, not the size of the answer: 1,658 of them carry at least one clearance decided in this window, and 751 hold at least 5 clearances with both dates and therefore carry a published median. The rest are answered in words — "a known device classification with no clearance in this window", or "below the threshold this snapshot publishes figures at" — with the record count shown and no figure invented to fill the space.
Why a median, and never an average
Review times under a product code are strongly right-skewed. Most clearances cluster within a few months of each other and a handful run for years, and the public record cannot say why. An average of that shape is dragged toward the long tail and lands on a number that describes no actual submission. The median is the middle value: half of the clearances under the code took less, half took more.
A middle value on its own is still misleading, because it says nothing about how wide the spread is. So the middle half — the 25th to the 75th percentile — is stated next to it in the same sentence, drawn as a band on the spread strip, and the 80th and 90th percentiles are shown as well. Those two exist because the question a reader actually has after "how long usually" is "how long at the far end", and a page that shows only a median leaves them to invent the far end for themselves.
What receipt-to-decision covers, and what it does not
The openFDA 510(k) record carries two dates: date_received and
decision_date. Everything on this page is the elapsed calendar time
between them. That is a real, checkable, public quantity, and it is not the same
thing as FDA review time.
The elapsed span contains both the days the submission sat with FDA and the days it sat back with the submitter answering questions. The public record carries no field that separates the two, so nothing here separates them either — a code with a long median may be a code whose submissions are held for a long time, or a code whose submissions are turned around slowly, and these fields cannot tell you which. Any page that claims to have split them from these records has invented the split.
Two other limits are worth stating plainly. First, only decided submissions appear at all, so nothing here describes a submission still in review. Second, the figures are a description of past decisions under a code, not a property of the code: they carry no information about the quality of any particular submission, the deficiencies it drew, or the reviewer it was assigned to.
What is out of scope
De Novo and PMA are not covered. The openFDA 510(k) endpoint returns De Novo grants alongside clearances; this pipeline removes them before computing anything and counts them in the exclusion total, because a De Novo review is a different process with a different clock and folding it into a sentence about clearances would be the wrong population, not a rounding difference. PMA and HDE submissions live in separate endpoints and are not in this snapshot at all.
There is also no model here. No regression, no extrapolation, no adjustment for submission quality, no per-submission figure of any kind. Version 0.1 is a lookup over a dated file of what already happened, and everything on the page is a count or a percentile of records that exist. If you want to know how a specific submission is likely to go, this page cannot tell you, and neither can the underlying data.
Why we are giving it away
Because the number is public and the arithmetic is not hard, and because the way a firm handles an uncertain number tells you most of what you need to know about working with them. We would rather show you that with a free tool than assert it on an about page.
If the tail in your product code is the thing worrying you, that is a conversation about file quality — which is what the gap scan and the DHF buildout are for.
Where the data comes from, and how it refreshes
The source is the openFDA device 510(k) API, which publishes United States government works that are in the public domain in the US. No account or key is needed to query it, and none is used here. openFDA can lag FDA's own source systems, so a decision made recently may not appear in these figures for some weeks; the snapshot's generated date and openFDA's own last-updated date are both printed on every result.
A scheduled job re-runs the pipeline weekly and opens a pull request with the new snapshot. It never writes to the published branch on its own: a person reads the diff and merges it. That is the same approval step every other number on this site goes through, and it is why the date on the page is always a date somebody signed off.
Questions about these figures
What does this tool show?
For a 510(k) product code, the distribution of elapsed days between the FDA receipt date and the decision date, taken from public openFDA records. It shows a median with the middle half of clearances beside it, the 80th and 90th percentiles, a histogram, and the same figures broken out by decision year. It describes past records under that code. It is not a statement about any particular submission.
Does this cover De Novo or PMA submissions?
No. This tool covers 510(k) clearances only, and out of scope means out of the numbers as well as out of the copy: De Novo grants returned by the same openFDA endpoint are removed before any figure is computed, and counted in the exclusion total. PMA and HDE submissions come from different endpoints and are not in this snapshot at all.
Why a median rather than an average?
Review times are strongly right-skewed: most clearances under a code cluster, and a few run for years. An average is pulled toward those few and ends up describing no actual submission. The median is the middle value, so half of the clearances took less and half took more. The 25th and 75th percentiles are shown next to it because a middle value on its own hides how wide the spread is.
What does "days from receipt to decision" include?
It is elapsed calendar time between two public fields: the date FDA recorded the submission as received and the date of the decision. That elapsed time contains both the days the submission spent with FDA and the days it spent back with the submitter answering an Additional Information request. The public 510(k) record carries no field separating the two, so nothing on this page separates them either. A long elapsed time may reflect a long hold rather than a long review, and these records cannot tell you which.
Why do some product codes show no figures?
Because the snapshot removes any cell computed from fewer than 5 clearances before it is published. With three clearances under a code, a median is not a distribution, it is a description of three identifiable submissions. The record count is still shown, so a thin code reads as "3 records, too few to summarise" rather than as an empty page. A code with no clearance at all in the window is still findable and says so plainly.
How current are these numbers?
This snapshot was generated on 2026-10-06 from openFDA records covering decisions between 2018-01-01 and 2026-10-06. The openFDA index itself reported a last-updated date of 2026-09-28, and openFDA can lag FDA source systems by weeks. A recent decision may not be in these figures yet. The snapshot date is shown on every result and on the printed brief.
How were the percentiles calculated?
By linear interpolation between the closest order statistics — the inclusive method, which is what numpy.percentile does by default and what PERCENTILE.INC does in a spreadsheet. The method is named because the same set of numbers gives different percentiles under the six common definitions, and a percentile with no stated method cannot be reproduced. All figures are rounded to whole days, half away from zero.
Can I check these numbers myself?
Yes, and that is the point of the source panel on every result. It shows the literal openFDA query the snapshot was built from, so the same records can be pulled without this site. The pipeline that turns those records into figures is a short, tested Python script; the suppression rule and the percentile method are both asserted by its tests.